Scroll to view more![]()
Comparison of SBC overall matric results 2020 – 2025 | ||||||
| 2020 | 2021 | 2022 | 2023 | 2024 | 2025 | |
Pass Rate | 100% | 100% | 100% | 99.1% | 99% | 100% |
University Entrance | 97.27% | 97.22% | 99.12% | 95.5% | 94.55% | 99% |
Number of Matrics | 110 | 108 | 113 | 111 | 110 | 124 |
Distinctions | 223 | 203 | 273 | 250 | 256 | 337 |
Distinction Rate per boy | 2.02 | 1.88 | 2.42 | 2.25 | 2.33 | 2.7 |
Comparison of SBC matric subject averages 2020 – 2025 | ||||||
| 2020 | 2021 | 2022 | 2023 | 2024 | 2025 | |
English | 72.15% | 72.01% | 71.85% | 72.45% | 72.84% | 72.73% |
Afrikaans | 60.51% | 63.03% | 63.87% | 63.59% | 63.21% | 66.68% |
IsiZulu | 81.8% | 70.5% | 70.2% | 76.67% | 67.53% | 64.46% |
Mathematics | 67.07% | 71.04% | 74.22% | 70.85% | 70.78% | 76.84% |
Maths Literacy | 78.70% | 78.84% | 74.25% | 72.64% | 71.77% | 78.79% |
Physical Science | 65.37% | 69.05% | 70.82% | 64.11% | 65.07% | 75.02% |
Geography | 63.48% | 68.92% | 65.76% | 62.30% | 67.14% | 67.85% |
Information Technology | 86.24% | 76.00% | 83.24% | 80.70% | 78.62% | 81.52% |
Life Sciences/Biology | 67.68% | 73.94% | 71.43% | 66.42% | 69.4% | 74.32% |
History | 73.50% | 72.40% | 73.32% | 77.79% | 75.22% | 72.03% |
Accounting | 64.16% | 59.00% | 63.19% | 61.94% | 62.67% | 62.31% |
Business Studies | 73.10% | 70.56% | 71.13% | 74.45% | 71.82% | 73.11% |
Art | 67.45% | 69.55% | 69.65% | 68.29% | 63.58% | 63.86% |
Dramatic Arts | 71.53% | 72.37% | 80.59% | 82.80% | 82% | 77.62% |
Life Orientation | 76.56% | 78.83% | 82.73% | 80.60% | 81.16% | 82.19% |
Music | 70.57% | 63.70% | 61.86% | 63.11% | 21% | 50.14% |
Further Studies Stats | 69.89% | 67.64% | 56.71% | 59.40% | 45.5% | 66.06% |
Further Studies Calculus | – | – | 64.87% | 64.36% | 63.1% | 74.81% |
Mandarin | – | – | 96.67% | 96.00% | 94.8% | |
Further Studies English | – | – | – | – | 81.3% | 76.4% |
Scroll to view more![]()
Comparison of SBC overall matric results 2014 – 2019 | ||||||
| 2014 | 2015 | 2016 | 2017 | 2018 | 2019 | |
Pass Rate | 100% | 100% | 100% | 100% | 100% | 100% |
University Entrance | 97.25% | 97.0% | 96% | 96.6% | 97.6% | 96.9% |
Number of Matrics | 109 | 127 | 137 | 118 | 126 | 127 |
Distinctions | 225 | 253 | 329 | 206 | 265 | 219 |
Distinction Rate per boy | 2.06 | 1.99 | 2.4 | 1.75 | 2.1 | 1.72 |
Comparison of SBC matric subject averages 2014 – 2019 | ||||||
| 2014 | 2015 | 2016 | 2017 | 2018 | 2019 | |
English | 70.32% | 70.88% | 72.53% | 69.95% | 72.29% | 70.05% |
| AP English | 61.67% | 65.25% | 72% | 57.22% | 62% | – |
Afrikaans | 65.50% | 60% | 62.76% | 62.10% | 64.42% | 60.69% |
IsiZulu | 70.7% | |||||
Mathematics | 72.38% | 71.66% | 76.13% | 74.67% | 73.36% | 67.57% |
Maths Literacy | 81.24% | 76.17% | 77.05% | 78.56% | 75.81% | 79.77% |
AP Maths | 69.34% | 66.49% | 67.20% | 75.00% | 64.76% | – |
Physical Science | 69.72% | 71.10% | 72.18% | 69.71% | 72.16% | – |
Geography | 68.84% | 65.51% | 66.68% | 68.25% | 65.45% | 65.34% |
Information Technology | 84.13% | 82.89% | 87.63% | 87% | 83.96% | 83.85% |
Life Sciences/Biology | 73.97% | 73.57% | 72.05% | 69.93% | 75.58% | 68% |
History | 64.06% | 66.95% | 71.59% | 71.54% | 74.75% | 71.72% |
Accounting | 66.41% | 60.26% | 59.88% | 60.95% | 64.18% | 60.69% |
Business Studies | – | – | 59.75% | – | 65.77% | 71.17% |
Art | 70.83% | 63.13% | 57.38% | 64.30% | 68.38% | – |
Dramatic Arts | 71.97% | 67.58% | 78.67% | 72.81% | 73.96% | 69.65% |
Life Orientation | 78.02% | 79.31% | 77.77% | 74.43% | 77.56% | 79.24% |
Music | 70.70% | 68% | 68.40% | 73.83% | 80.5% | – |
Scroll to view more![]()
Comparison of SBC overall matric results 2008 – 2013 | ||||||
| 2008 | 2009 | 2010 | 2011 | 2012 | 2013 | |
Pass Rate | 100% | 100% | 100% | 100% | 100% | 100% |
University Entrance | 94.40% | 93.50% | 93.90% | 92.60% | 96.08% | 96.40% |
Number of Matrics | 108 | 108 | 116 | 122 | 102 | 112 |
Distinctions | 181 | 142 | 226 | 214 | 146 | 280 |
Distinction Rate per boy | 1.68 | 1.31 | 1.94 | 1.75 | 1.43 | 2.6 |
Comparison of SBC matric subject averages 2008 – 2013 | ||||||
| 2008 | 2009 | 2010 | 2011 | 2012 | 2013 | |
English | 70.00% | 68.80% | 68.90% | 68.40% | 68.08% | 72.2% |
Afrikaans | 60.10% | 60.80% | 61.10% | 58.80% | 59.64% | 65.22% |
Mathematics | 74.20% | 71.30% | 71.50% | 74.40% | 69.55% | 74.23% |
Maths (Paper 3) | 74.00% | 65.10% | 70.10% | 69.10% | 67.54% | 72.45% |
Maths Literacy | 74.90% | 77.30% | 75.40% | 78.20% | 80.12% | 82.12% |
Admaths | 73.20% | 66.60% | 67% | 69% | 66.53% | 65.54% |
Physical Science | 66.20% | 60.60% | 65.20% | 61.70% | 61.65% | 70.22% |
Geography | 68.80% | 68.60% | 69% | 69.90% | 67.37% | 65.95% |
Information Technology | 85.70% | 84.90% | 84.20% | 81.90% | 82.77% | 81.32% |
Computer Applications (CAT) | 64.90% | 61.60% | 65.10% | 65% | 57.55% | – |
Life Sciences/Biology | 70.60% | 71.20% | 73.10% | 68% | 70.03% | 73% |
History | 70.70% | 66.40% | 68.90% | 72.90% | 64.78% | 65.92% |
Accounting | 59.30% | 65.10% | 67.20% | 70.50% | 61.85% | 64.09% |
Art | 62.90% | 57.10% | 57.40% | 62.30% | 62.73% | – |
Dramatic Art | – | – | – | – | 73.58% | 72.20% |
Life Orientation | 73.20% | 72.50% | 76.30% | 75% | 70.52% | 78.17% |
Music | – | – | – | – | – | 69.57% |
Scroll to view more![]()
Comparison of SBC overall matric results 2000 – 2007 | ||||||||
| 2000 | 2001 | 2002 | 2003 | 2004 | 2005 | 2006 | 2007 | |
Pass Rate | 100% | 100% | 100% | 100% | 100% | 100% | 100% | 100% |
University Entrance | 91.60% | 91.40% | 87.9% | 91.60% | 89.50% | 96.70% | 97.50% | 94.80% |
Number of Matrics | 60 | 58 | 66 | 83 | 76 | 90 | 81 | 98 |
Distinctions | 71 | 85 | 96 | 93 | 73 | 115 | 124 | 129 |
Distinction Rate per boy | 1.18 | 1.47 | 1.45 | 1.12 | 0.96 | 1.28 | 1.53 | 1.32 |
Comparison of SBC matric subject averages 2000 – 2007 | ||||||||
| 2000 | 2001 | 2002 | 2003 | 2004 | 2005 | 2006 | 2007 | |
English | 63.50% | 65.80% | 68.40% | 67.80% | 65.70% | 64.60% | 66.90% | 67.20% |
Afrikaans | 55.90% | 60.40% | 62.30% | 58.10% | 59.20% | 59.20% | 64.10% | 59.40% |
Mathematics | 72.50% | 76.50% | 72.50% | 68.80% | 69.30% | 66.30% | 71.20% | 69.20% |
Maths (Paper 3) | – | – | – | – | – | – | – | – |
Maths Literacy | – | – | – | – | – | – | – | – |
Admaths | 79.50% | 80.80% | 65.50% | 64.10% | 60.10% | 60.30% | 76.80% | 70.80% |
Physical Science | 63.50% | 60.90% | 64.50% | 62.70% | 60.60% | 66.30% | 70.10% | 69.50% |
Geography | 63.60% | 71.30% | 67.30% | 66.20% | 63.00% | 65.00% | 68.70% | 67.40% |
Information Technology | 80.90% | 82.70% | 87.20% | 85.10% | 75.80% | 84.60% | 85.90% | 87.10% |
Computer Applications (CAT) | – | – | – | – | – | – | – | – |
Life Sciences/Biology | 58.80% | 61.80% | 71.7% | 63.80% | 60.70% | 66.70% | 68.10% | 68.00% |
History | 65.40% | 70.20% | 72.4% | 69.20% | 74.30% | 71.50% | 71.30% | 67.70% |
Accounting | 52.20% | 56.80% | 64.50% | 62.80% | 65.20% | 66.60% | 75.60% | 66.70% |
Art | – | – | – | – | – | – | 60.60% | 61.10% |
Dramatic Art | – | – | – | – | – | – | – | – |
Life Orientation | – | – | – | – | – | – | – | – |
Music | – | – | – | – | – | – | – | – |
Matric Class of 2025 IEB Examination Results
The Management and Staff of St Benedict’s College are proud to announce the outstanding performance of our Class of 2025 in the IEB National Senior Certificate examinations. These results represent an exceptional milestone in the life of the College and, in many respects, set a new benchmark of excellence to which future generations of Bennies boys can aspire.
While it is customary to celebrate our top academic achievers, these results are, in fact, a collective success. They reflect the commitment, resilience, and perseverance of every boy who sat for the examinations, each of whom contributed meaningfully to this remarkable outcome. The Class of 2025 has demonstrated that sustained effort, discipline, and integrity yield results of the highest order.
Such success is never achieved in isolation. These results are the product of a powerful partnership between our dedicated boys, supportive and engaged parents, and a passionate, nurturing teaching staff who consistently go above and beyond in their calling. We acknowledge with gratitude the professionalism, care, and unwavering belief that our teachers place in every boy that was entrusted to them. Well done, one and all.
Highlights
A summary of the results below demonstrates the calibre of teaching and learning that takes place throughout St Benedict’s College:
Class of 2025 top achievers
15 candidates obtained seven distinctions or more, they were:
- Jordan Dos Santos – 93.6% average (10 Distinctions)
- Charlton Chung – 91% average (10 Distinctions)
- Adham Gittings – 91.7% average (9 Distinctions)
- Diego Brazao – 90.4% average (9 Distinctions)
- Keegan Kung – 89.3% average (9 Distinctions)
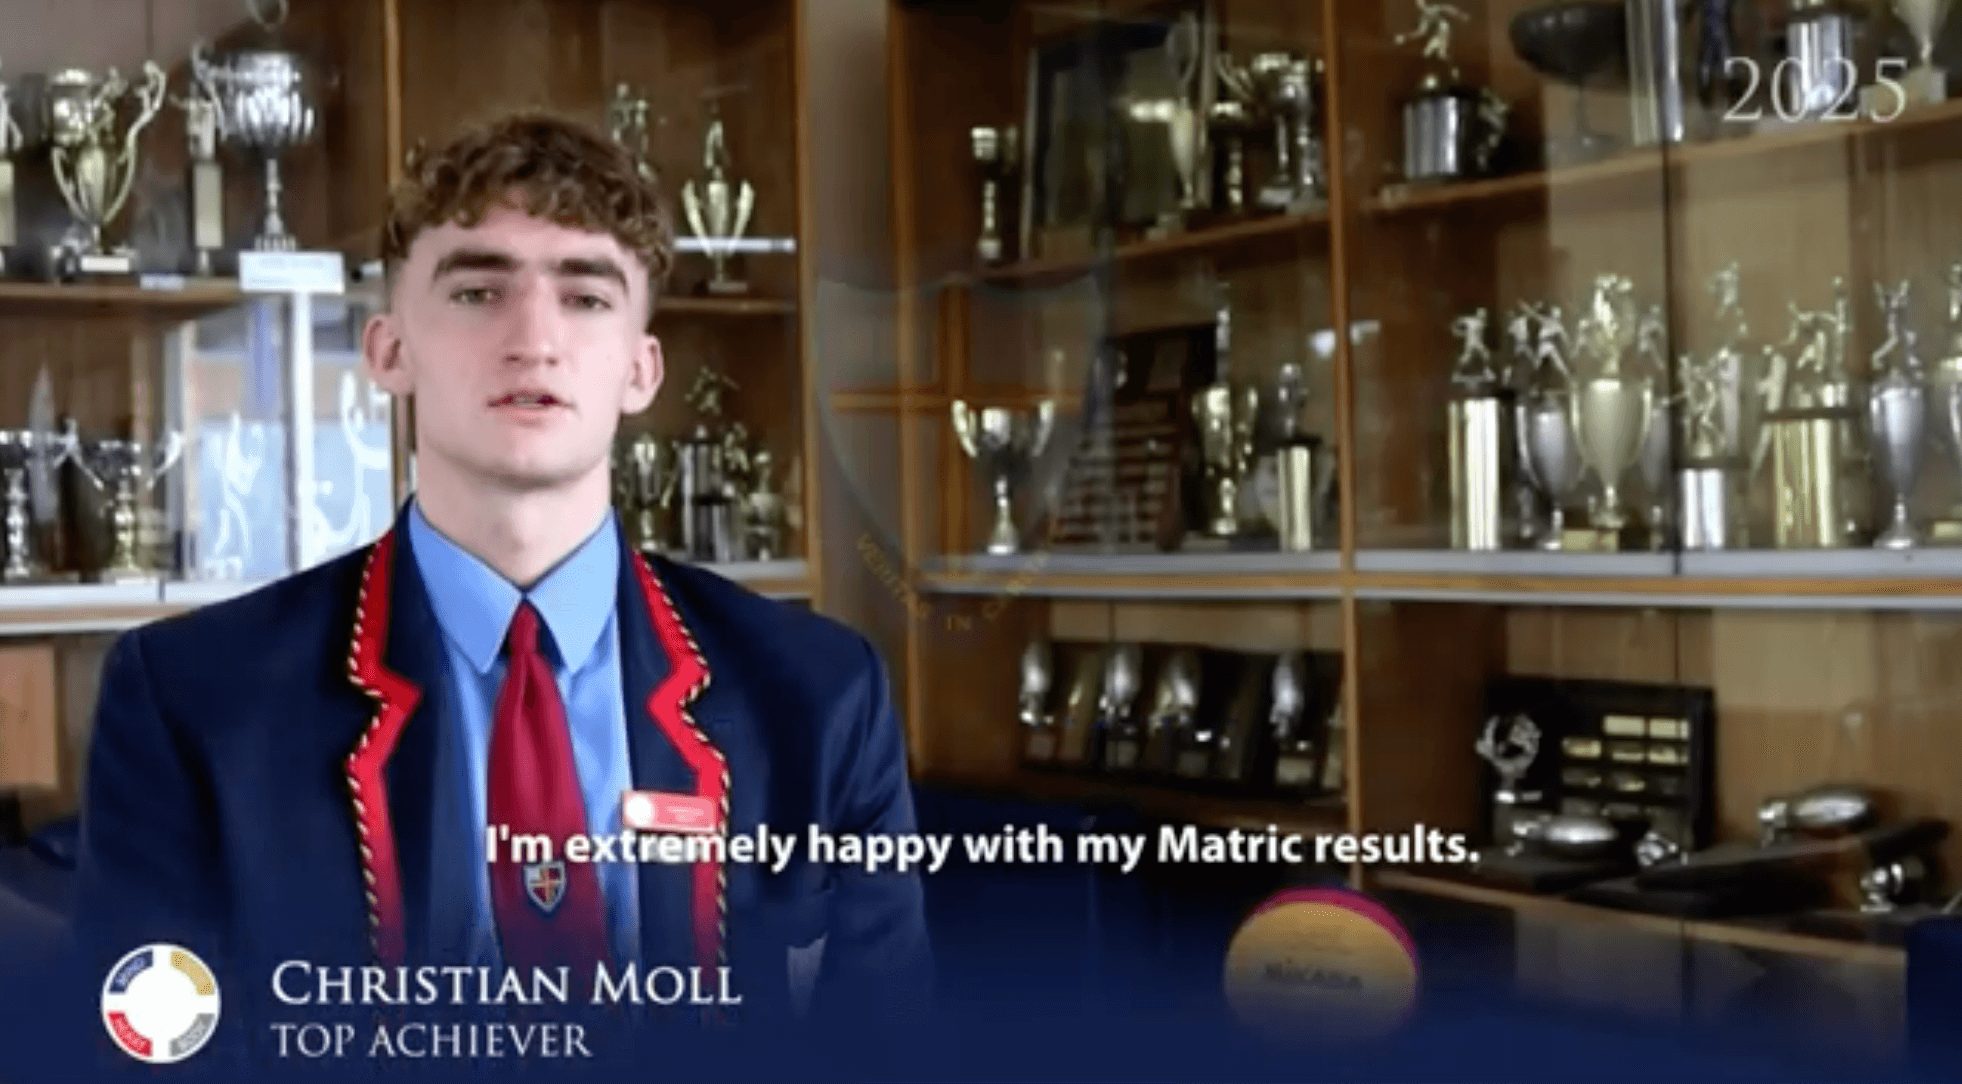
- Christian Moll – 92.1% average (9 Distinctions)
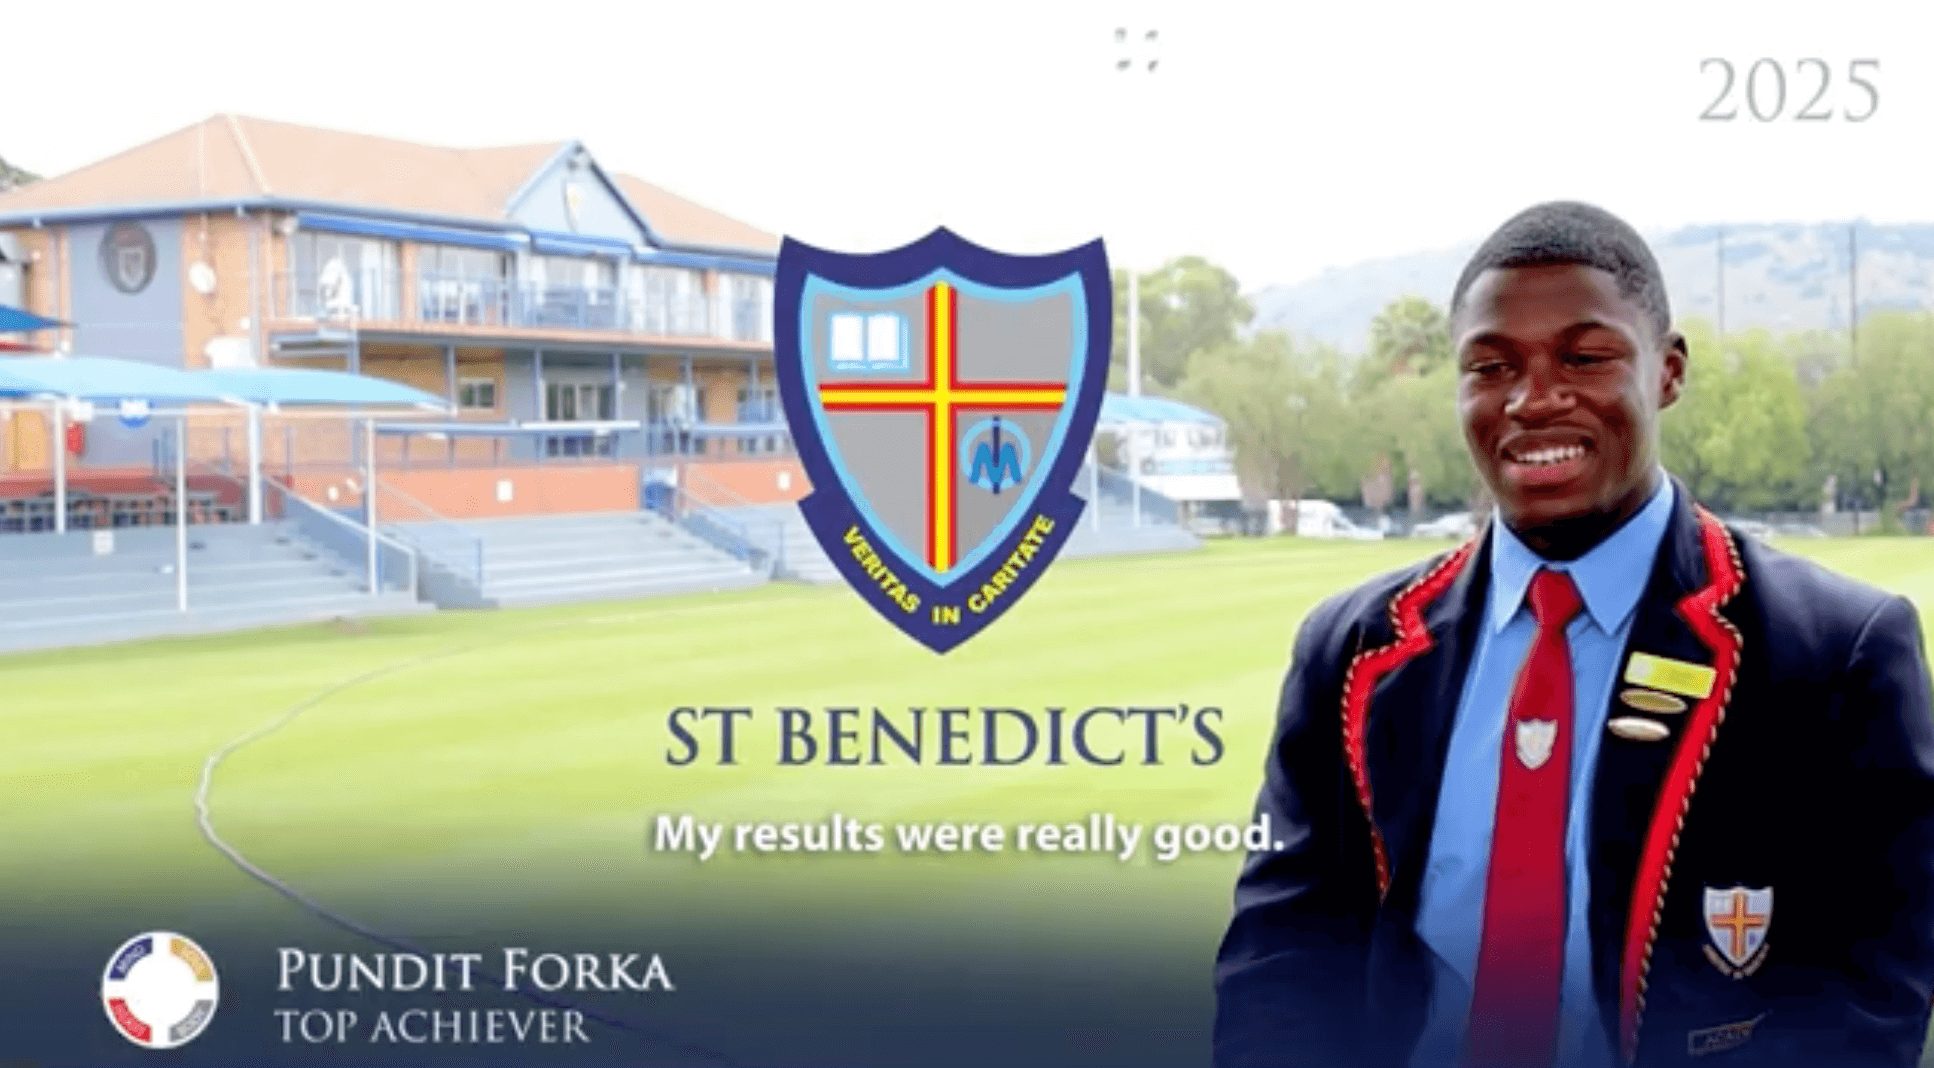
- Pundit Forka – 91.0% average (8 Distinctions)
- Andrew Scott-White – 89.4% average (8 Distinctions)
- Adrian Emwanu – 86.7% average (8 Distinctions)
- Kevin Hubbard – 89.3% average (7 Distinctions)
- Ryan Van Zyl – 87.3% average (7 Distinctions)
- Diego Dos Anjos – 85.3% average (7 Distinctions)
- Cameron Adams – 84.9% average (7 Distinctions)
- Gabriel Bastos – 84.4% average (7 Distinctions)
- Ikechukwu Ejike – 81.4% average (7 Distinctions)
Jordan Dos Santos, Adham Gittings, Christian Moll and Pundit Forka featured on the IEB Outstanding Achievers’ List (Top 5% nationally in 6 subjects and a distinction in Life Orientation) while Diego Brazao, Charlton Chung and Kevin Hubbard featured on the IEB Commendable Achievers List (Top 5% nationally in 5 subjects and a distinction in Life Orientation)
The following boys achieved results in the top 1% nationally within a subject:
- Jordan Dos Santos (English, History, Life Orientation, Life Sciences, Physical Sciences)
- Pundit Forka (English, Life Orientation)
- Charlton Chung(Geography, Mathematics)
- Andrew Scott-White(Mathematics, Physical Sciences)
- Kevin Hubbard (Geography, Mathematics)
- Christian Moll (History, Life Orientation)
- Diego Brazao (Mathematics)
- Kwanda Magugula (Life Orientation)
- Kaleb Teka (Business Studies)
- Adham Gittings (Business Studies)
In addition:
- 3 candidates obtained 6 distinctions: Cristiano Brites, Nicolas Stiff, Ikechukwu Ejike
- 10 candidates obtained 5 distinctions: Ka Shing Mak, Keagan Kumnig, Kaleb Teka, Marcio Martins, Connor Odgers, Cayden Thompson, Tyler Pharo, Luca Saffy, Ipeleng Nare and Talhah Boda
- 12 candidates obtained 4 distinctions
- 11 candidates obtained 3 distinctions and
- A further 50 boys obtained 1 or 2 distinctions
2025 top matriculants
The top achieving students from the St Benedict’s College Class of 2025!
*Ranking by number of distinctions achieved.

Jordan Dos Santos
10 distinctions (93.6%)
 Chung (1)")
Charlton Chung
10 distinctions (91%)

Christian Moll
9 distinctions (92.1%)

Adham Gittings
9 distinctions (91.7%)

Diego Brazao
9 distinctions (90.4%)

Keegan Kung
9 distinctions (89.3%)

Pundit Forka
8 distinctions (91%)

Andrew Scott-White
8 distinctions (89.4%)

Adrian Emwanu
8 distinctions (86.7%)

Kevin Hubbard
7 distinctions (89.3%)

Ryan Van Zyl
7 distinctions (87.3%)

Diego Dos Anjos
7 distinctions (85.3%)

Cameron Adams
7 distinctions (84.9%)

Gabriel Bastos
7 distinctions (84.4%)

Ikechukwu Ejike
7 distinctions (81.4%)

Cristiano Brites
6 distinctions (85.7%)

Keagan Kumnig
6 distinctions (85%)

Nicolas Stiff
6 distinctions (84.3%)

Kaleb Teka
5 distinctions (84.7%)

Marcio Martins
5 distinctions (84.1%)

Connor Odgers
5 distinctions (83.7%)
 Dong")
Peter Dong
5 distinctions (83%)

Cayden Thompson
5 distinctions (82.9%)

Ka Shing Mak
5 distinctions (82%)

Tyler Pharo
5 distinctions (81.9%)

Luca Saffy
5 distinctions (81.6%)

Ipeleng Nare
5 distinctions (80.4%)

Talhah Boda
5 distinctions (79.1%)

Chris Hong
4 distinctions (82.9%)

Keenan Sparrow
4 distinctions (82.6%)

Jordi Pereira
4 distinctions (80.4%)

Saien Padayachi
4 distinctions (79.7%)

Hayden Evans
4 distinctions (79.1%)

Zach Scullard
4 distinctions (79%)

Matthew Steyn
4 distinctions (77.4%)

Dylan Holm
4 distinctions (77.3%)

Nicola Toich
4 distinctions (77.1%)

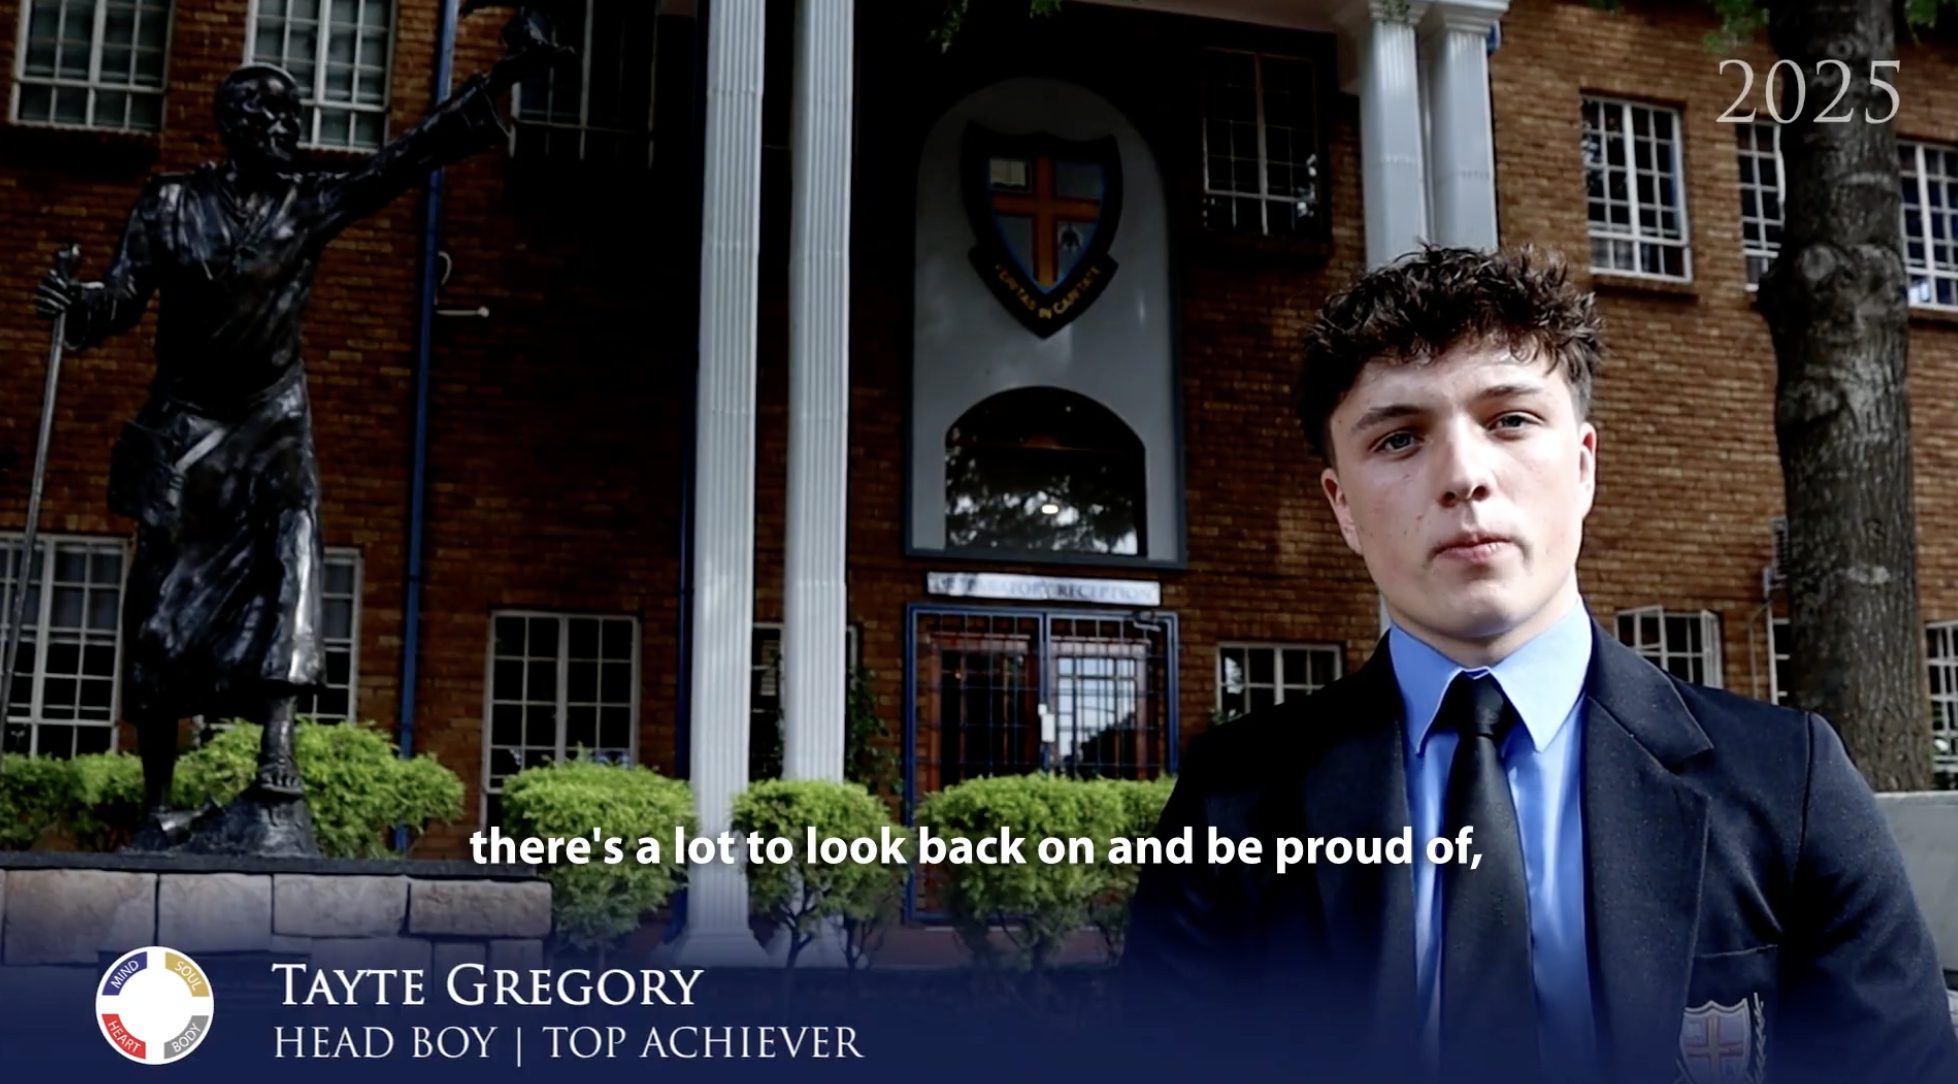
Tayte Gregory
4 distinctions (76.4%)

Gianluca Dionisio
4 distinctions (75.7%)
Our matrics react to their results